29 December 2013

29 DEC 2013, Sunday

  • For those that follow fundamentals...a good representation of the general business cycle.
  • Overall, it's reasonable.
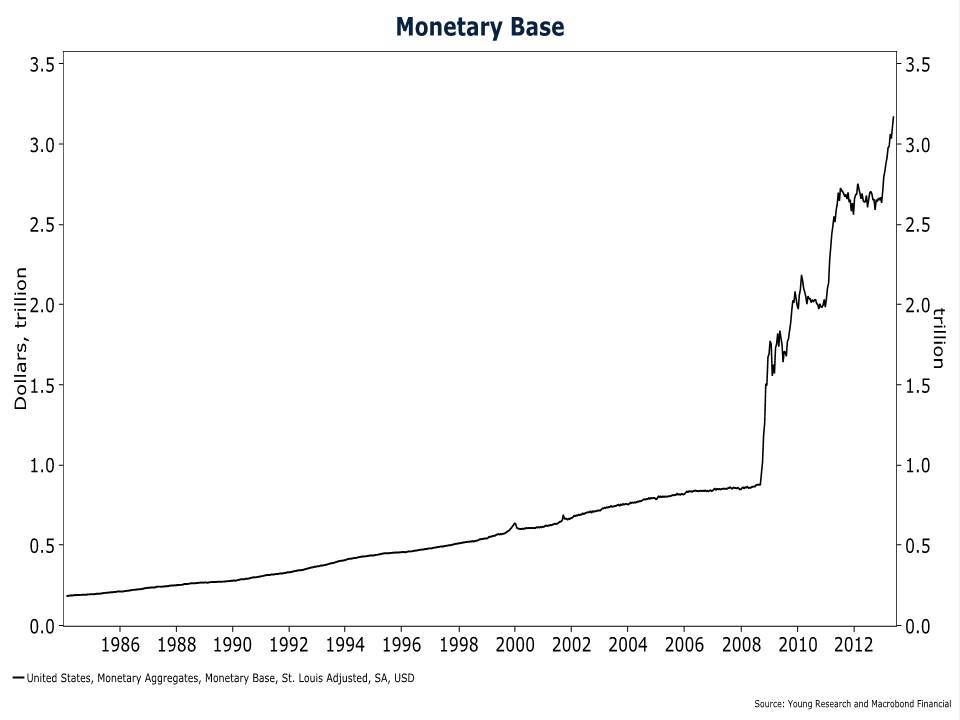
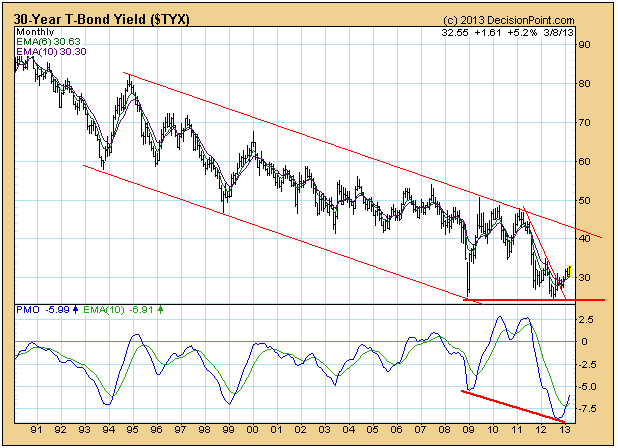
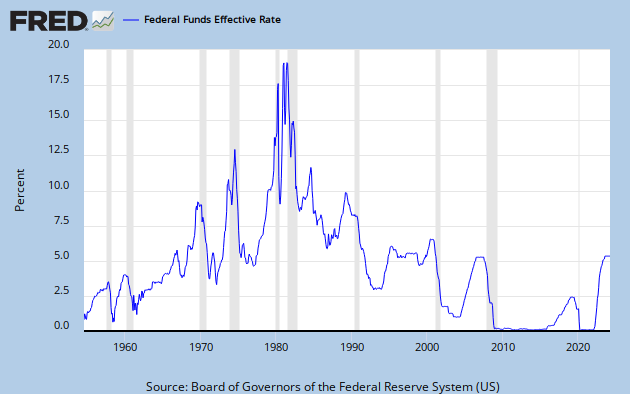
  • I wonder how it is being affected by the manipulations of the Federal Reserve's Quantitative Easing.
  • Currently, we seem to be somewhere in the Stage 4 (approaching Stage 5 phase)???
  • Trendlines and sentiment readings from previous post are still in play.  It's been a slow upward grind which is always a challenging environment.
  • Time will tell.


14 November 2013

14 NOV 2013, Thursday


  • Interesting...stock market has big moves after inflationary periods and major wars...about 4 years after.


23 October 2013

23 OCT 2013, Wednesday


  • Hat tip to Pug Sma (address on chart)...some of his projections are drawn.
  • Back up at that upper channel line that has contained the entire upmove since 2009.  It has been solid resistance in the past...
  • Now to see if it still is!

30 September 2013

30 SEP 2013, Monday


  • Government Shutdown Day!!!
  • Market's been slowly leaking downward supposedly over the fear of this day.  My guess is that they do a Continuing Resolution and the market gets a brief rally until it realizes that the October 17th Debt Limit is fast approaching.  This is all complete nonsense.  Oh well.
  • Leaning to the short side on any rallies which fail short of new highs.
  • Looking for the August lows to be taken out and the June lows to be challenged.
  • Presidential Cycle below.

07 September 2013

7 SEP 2013, Saturday

  • Interesting...above...the monthly payment (less property tax) for various loans at various mortgage rates.
  • Thinking the recent SP500 bounce may be reaching it's end.  Looking for SP500 1570-1540.


09 August 2013

9 AUG 2013, Friday

  • Where the heck does it all go?  
  • And what bank would allow overdraft checking on this account???


22 July 2013

22 JUL 2013, Monday


  • Seems like it's getting time for Wall Street to begin off-loading their stocks to the retail investors again in preparation for the next bear market.
  • Tops are a process....since it takes Da Boyz time to offload without causing major damage to the prices they want.  So, it will be a volatile next 6 months with probably four roughly 10% moves (down, up, down, up...soooo, basically sideways overall...then the 18 month Bear for down 35%(?)).
  • The first down move is very soon...nobody knows where it starts from...1700, 1730?
  • Of course, their is a chance that the market just goes parabolic to the upside like it did in the 1990's.  However, I think that is a much lower probability since we don't have an economy to support it.
  • Start deciding what you want to do now!
  • DO NOT PLAY THEIR GAME!
  • DO NOT GET CAUGHT AGAIN!!!

07 July 2013

7 JUL 2013, Sunday

  • Sure...the US doesn't pay as much for gas per gallon but we spend a much greater percentage of our income on gasoline.


27 June 2013

27 JUN 2013, Thursday

  • The age of ever lower interest rates is more than likely over.
  • Hat tip to the author (website on chart).
  • Sooo...the retiree's were screwed with ultra low interest rates for the past few years.  Many may have stretched their time frame out on the yield curve for the higher rates.
  • Unfortunately they'll now learn the hard way, about the inverse relationship between bond funds and interest rates.
  • As interest rates go up, the value of bond funds go down.  OUCH!


25 June 2013

20 JUN 2013, Thursday

  • Grandparents Rules...'Nuff said!


01 June 2013

1 JUN 2013, Saturday


30 May 2013

30 MAY 2013, Thursday

  • Whoa!  Sure is nice to know that our politicians and our wealthy won't be struggling to keep their farms afloat...isn't it?
  • It's gotta be great when you can write laws that automatically send extra income your way!
  • Even better when you don't even have to fulfill the responsibilities of your job and you still get paid!
  • CON-gress...'Nuff said.


14 May 2013

14 MAY 2013, Tuesday

  • Correlation does not necessarily equal causation but the above graph is interesting.  Who's juicing this stock market the past few years when the economy is not?  And, if the FED's operations are the only thing propping everything up, what exactly happens when the FED stops?  
  • And, who do you think will know first about when it stops so they can take appropriate protective measures...Da Boyz or you?  
  • Interesting and historical times.
  • The FED's activities have distorted almost all markets to the point where true valuation and price discovery mechanisms are breaking down and just leave you scratching your head.  One market...OK...I could understand one market getting temporarily dislocated.  But, all the majors are convoluted...stocks, bonds, dollar, oil, gold.  Price signals have been crushed.  What do you trust?  Or perhaps we're in a large transition moment for each of those markets at the same time.  Will have to watch...one day at a time.
  • Good read for more thoughts...5 Questions that Every Bull Market Should Answer
  • The market is going up in any way you look at it.  Currently, it seems like it only inhales and never exhales.  
  • Is the market going to correct soon or go parabolic?  Will only know in hindsight...one day at a time.
  • Since this Bull run began in MAR 2009, this has been the longest run of days without so much as a 5% correction.  Would be nice to see a little bit of a healthy breather for a while to allow it to reset. 


  • A little historical perspective.  Again, it's still going up at this time.


03 May 2013

3 MAY 2013, Friday

  • Tops take time...but above shows some interesting history.
  • Good read...The Market With and Without QE
  • Dow Jones Industrial Average had a whole bunch of these relatively equal tops from 1965-1983.


10 April 2013

10 APR 2013, Wednesday

  • Super graphic, above, on where your tax dollars go.


07 April 2013

7 APR 2013, Sunday

  • Just an interest rate chart update. 


  • Ben Bernanke as a child...he was such a happy young fella!


05 April 2013

5 APR 2013, Friday


18 March 2013

18 MAR 2013, QE Update

(Chart via Societe Generale)

15 March 2013

15 MAR 2013 - Sentiment heating up?


  • NYSE reported margin debt levels top chart, annual rate of change middle chart, and margin account credit balance bottom chart.
  • Can go on for awhile as seen during the Internet Bubble years.
  • However, we are at the levels seen in the summer of 2007 and should alert folks to manage their individual risks as they see fit.
  • That message is reinforced by the Investor's Intelligence Bull Bear Sentiment (2nd chart above).  Check it for the recent 2011 top which was followed by a pretty sharp and sudden 20% down move.   
  • Again, it can go for awhile as it has in the past, but it should alert folks to how one sided the overall market is getting.
  • Manage your risks as you see fit.
  • Below chart, as George Slezak correctly points out, "Bottom line:  The markets seem 100% controlled by statements from the Fed."
  • They must have stocks pumped and gold bashed for as long as they can do it...and they are doing it!  Note the relationship between their SOMA Holdings and the other two markets below.
  • Odd coincidence...No?
  • It is understood that they did it to preserve assets and, thus, pension systems everywhere.  For that they should be applauded.


  • Final point, however...the Fed are academics not traders or investors.  Thus may not be considering how those groups think.  Or, perhaps they don't care because they are becoming complacent and actually are starting to believe in their own powers such as "the Great and Powerful Oz" once did.

  • During the summer of 2007, I was looking at this same relationship (above) with data that went back back to the 1970's (% deviation from 50 week moving average ... chart from dshort.com).  Back then it gave me absolute fear of the market being extremely extended with a real potential for the housing market to finally go "Pffffttt!" as the air rushed out of the bubble.  The condition even preceeded the 1987 Black Monday crash.
  • You don't see from the limited data, but this relationship existed prior to most bear markets since the 1970's. 
  • It did go on for a long time during the 1990's due to the Internet Boom.  However, that was a new technology which spread throughout the economy causing gains in efficiency and productivity everywhere.  Do we have anything like that today? 
  • Bubbles are caused when excessive free money is available through easy credit over an extended period of time.  One could easily make the point that the Fed has been doing exactly that for the past few years!
  • I'm not calling top...just calling for caution for those that may not be aware of the risk going forward.
  • Balloon in search of a pin?  Only time will tell.
  • Review your situation and determine what is the best course of action for you!