skip to main |
skip to sidebar
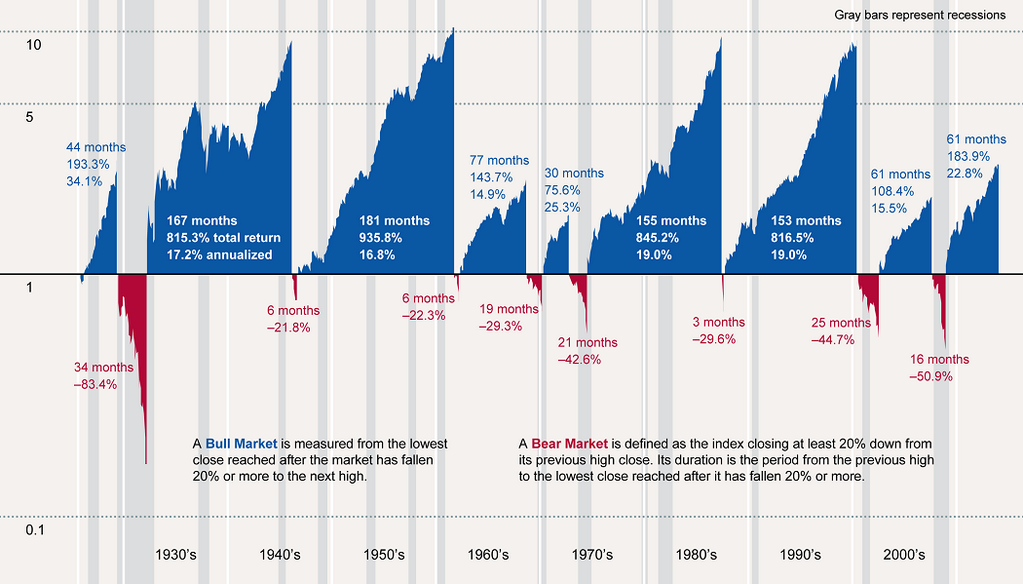
- Just some historical charts of recession lengths in months, market declines in %, and recovery lengths in months.


- Interesting after a long slow grind up, the market took a quick drop. The most recent 4 days basically took back all of June and July's climb upward.
- For quite some time now, the market has been respecting the green channel since 2011. And most recently, the white channel from 2013. If it's going to continue to respect the white channel, we should be watching the area from 1915 down to 1890. to see if it is.
- In addition, I've highlighted the areas and indicator readings where the white channel was respected over the past year. In each case, the market closed at least one day below the 90 day moving average (MA) depicted as a purple line and then got it's legs.
- Inflection point...time to see if the 2013 market personality is still here. Does the white channel save the day and then on to new highs against the green and white channels again? Or ,will the rising 200MA rise up in time to provide support. Or, do we fall to the green channel as it continues upward toward 1800?
- Fact is, I don't know. No one does. However, I do know what I'm watching for.
- Well, we're here at 1970 as suggested in last post. Mashed up against the trend channel.
- Higher? Anything is possible.
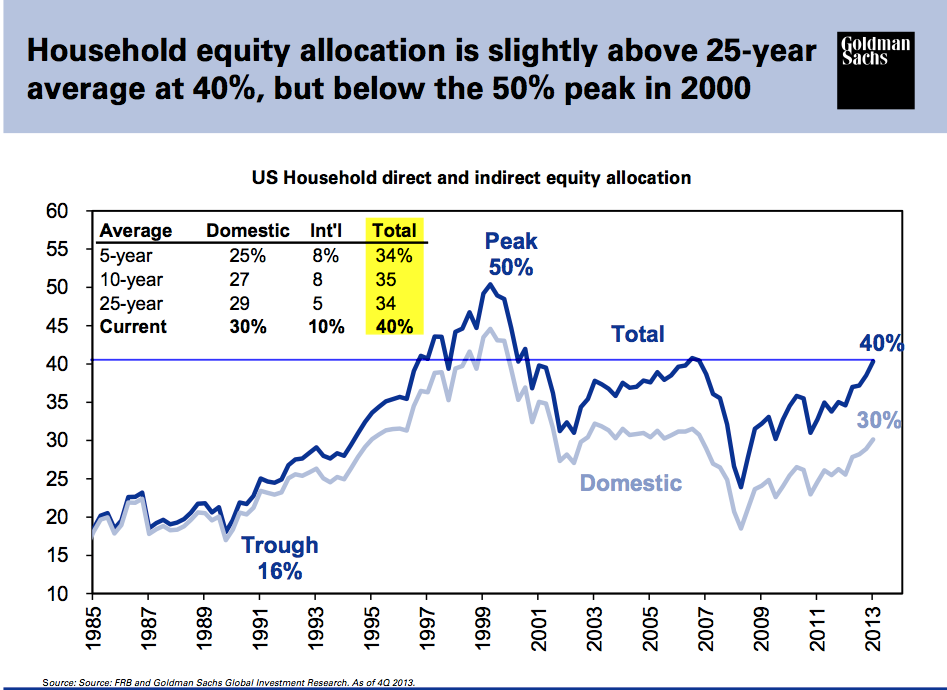
- However, the chart above indicates that Mom and Pop are in the market thinking that the Fed has their back. History shows it doesn't always work that way.
- The market is too high to buy and still too strong to sell. I have been day trading only for all of June.
- I absolutely don't want to be caught holding the bag that Wall Street wants to hand off to small investors who have been conditioned to buy all the dips because there is nothing but up.
- Holiday weeks tend to be up weeks due to light volume drift. And, so all the folks can talk happy talk at the BBQ and encourage one another to buy more stocks because they're doing so well.
- I'm thinking the likelihood of a 10-15% correction is looming large. Then we'll see how it looks for new highs prior to a sizeable 35% down move.
- Timing is always the hard part. That's why I take it one day at a time and wait to see what Ms. Market gives me.
- Food for thought...ever since we came off the Gold Standard, 7 year tops have shown themselves...1973, 1980, 1987, 1994 (year long sideways...1993?), 2000, 2007. And now we're in 2014. Hmmm...2+0+1+4 = 7???
- Best of luck to you!
- Hope you enjoy your Memorial Day weekend and remember those that gave their lives protecting our country and the freedoms we enjoy.
- Above are a normal scale chart and log chart that show a very similar resistance area. Can it break up and outward? It can do anything. But, those upper trendlines have repeatedly served as resistance. 1950's? 1970's?
- The author of the charts has a blog where he charts both the short and long term of many different markets: http://www.tradingchannels.co.uk/
- From...http://www.advisorperspectives.com/dshort/
- This Fed pumped market makes me nervous. Coupled with the pic above...now I understand why.
- Does it have to fall now? No.
- Just respect the environment you're in.
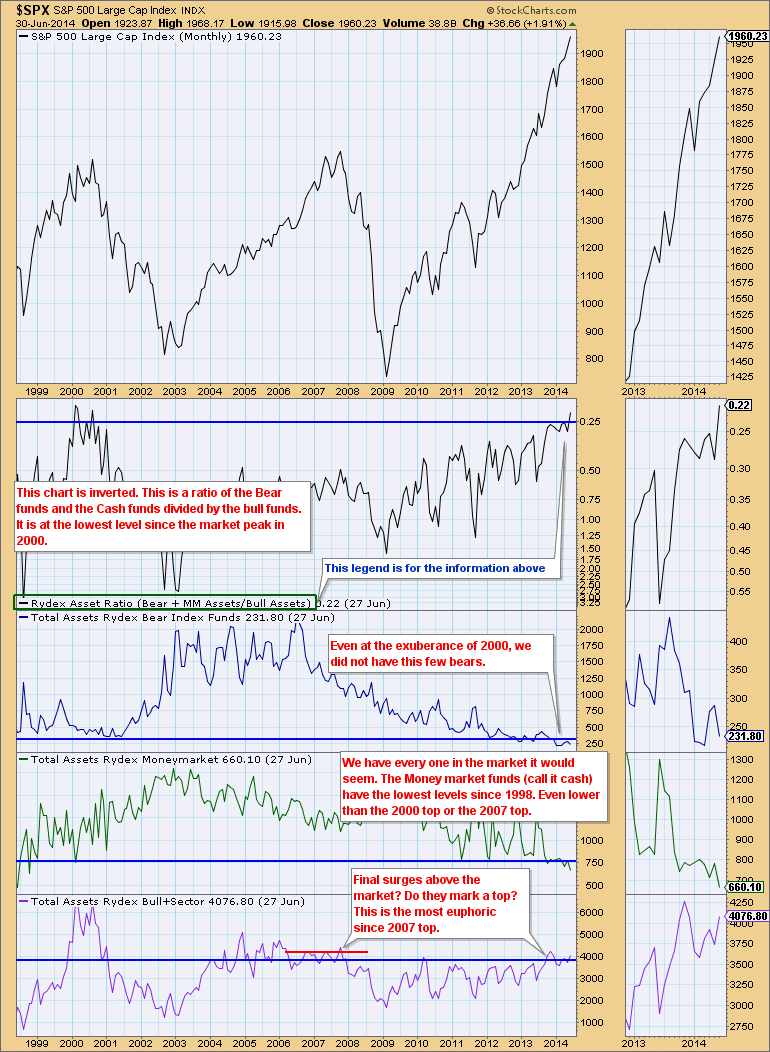
- Another thing suggesting danger is below which demonstrates the level of equity exposure by most "regular folks". Doesn't always work out like they hoped for.
- Items like this make me nervous but the market is still going up despite it's overbought condition.
- Can the market continue upward making everyone easy, free money? For how long?
- Historically markets inherently do whatever they need to do to deliver maximum pain to the most people possible.
- Above, things that continue to make me go, "Hmm."
- Great chartist and the link to his sight is contained in the graphic.
- Been a long time since we touched the 200 day moving average.
- Chart above shows similar stretches in days over the past.
- For comparisons:

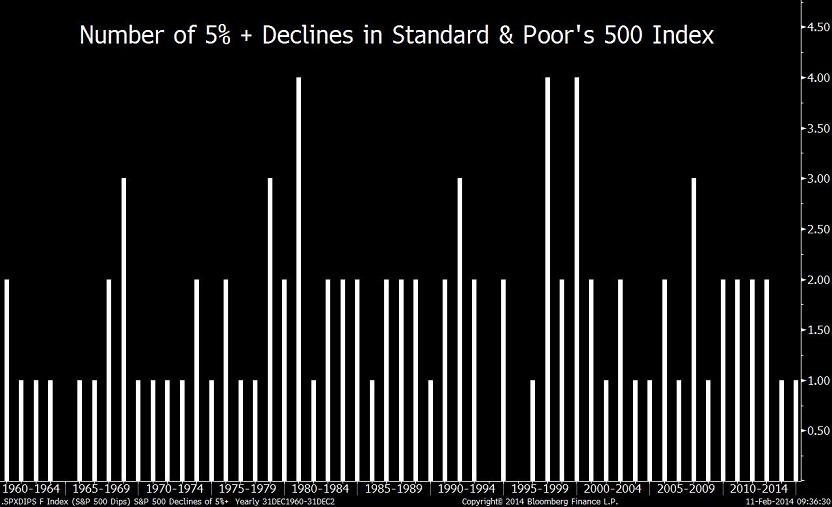
- Interesting Trading stats for future reference.


